Azarga Metals Announces Maiden Mineral Resource Estimate for Unkur Deposit
AZARGA METALS CORP. ("Azarga Metals" or the "Company") (TSX-V:AZR) announces the results of its maiden Mineral Resource estimate for its Unkur Copper-Silver Project in the Zabaikalsky Region of eastern Russia. The estimate is an Inferred Mineral Resource of 42 million tonnes at 0.52% copper and 38g/t silver, containing 220,000 tonnes (ie, 480 million pounds) of copper and 52 million ounces of silver. This equates to approximately 380,000 tonnes (ie, 840 million pounds) of copper equivalent at 0.90% or approximately 124 million ounces of silver equivalent at 91g/t, assuming a copper price of US$3.00/lb, silver price of US$20/oz and 100% recovery. The Mineral Resource estimate was independently prepared by SRK Consulting (Russia) Ltd. ("SRK"), in accordance with NI 43-101.
"The maiden Mineral Resource estimate is a very successful result from just our first few months of physical exploration at Unkur", said Dorian L. (Dusty) Nicol, the Company’s president and CEO. He went on to say, "importantly, mineralization is open in multiple directions, which supports growth potential" and "this further stimulates our belief that Unkur has the potential to be a globally significant copper-silver deposit."
A Technical Report covering the Mineral Resource estimate will be filed on SEDAR within 45 days of this news release.
SUMMARY
An Inferred Mineral Resource was estimated based on three domains. Zone 1 is the stratigraphically upper zone of mineralization and Zone 2 is the stratigraphically lower zone, which is divided into a northern (N) and southern (S) sub-zone. Zone 1 and Zone 2 are further divided into near surface and underground mineralization.
Table 1: Unkur Copper-Silver Project Inferred Mineral Resource estimate summary as at 31 March 2017
| Category / zone |
Tonnage (million tonnes) |
Copper grade (%) |
Silver grade (g/t) |
Copper equivalent grade (%) |
Silver equivalent grade (g/t) |
|
| Near surface (NS) | ||||||
| - Zone 1 | 23 | 0.54 | 40 | 0.93 | 95 | |
| - Zone 2 (North) | 9 | 0.47 | 43 | 0.89 | 91 | |
| - Zone 2 (South) | 1 | 0.42 | 4 | 0.46 | 47 | |
| - Total near surface | 33 | 0.52 | 39 | 0.90 | 92 | |
| Underground (UG) | ||||||
| - Zone 1 | 8 | 0.53 | 34 | 0.86 | 88 | |
| - Zone 2 (North) | 1 | 0.47 | 43 | 0.89 | 91 | |
| - Total underground | 10 | 0.52 | 35 | 0.87 | 88 | |
| Zone 1 NS + UG | 31 | 0.54 | 38 | 0.91 | 93 | |
| Zone 2 NS + UG | 11 | 0.46 | 38 | 0.84 | 85 | |
| Total Resource | 42 | 0.52 | 38 | 0.90 | 91 |
Notes: (1) CIM Definition Standards were followed for Mineral Resources; (2) Pit constrained Mineral Resources are reported within a conceptual pit shell; (3) Mineral resources are not Mineral Reserves and do not have demonstrated economic viability; (4) Mineral Resources are reported at a cut-off grade of 0.3% copper equivalent for near surface and 0.7% copper equivalent for underground; (5) copper and silver equivalent grades were estimated using US$3.00/lb copper price, US$20.00/oz silver price and 100% recovery using the formulae Cu eq = Cu + (0.009722 x Ag) and Ag eq = Ag + (102.86 x Cu); and (6) numbers may not add due to rounding.
Figure 1: Plan view of Inferred Mineral Resource zones

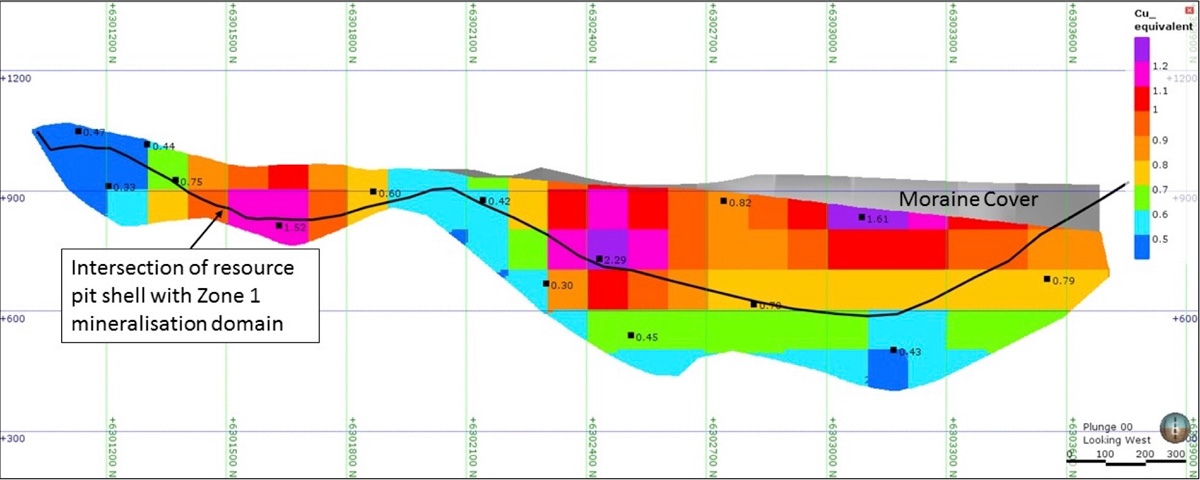
Figure 2: Long section showing grade distribution
GROWTH POTENTIAL
Azarga Metals considers that there is strong potential to grow the Mineral Resource at the Unkur Copper-Silver Project beyond that identified in this maiden Mineral Resource estimate. The mineralization is open in both directions along strike and further exploration drilling will aim to extend mineralization along strike. Of key interest for growth potential is the zone of thicker and higher grade mineralization in the northern part of the Inferred Mineral Resource area (see Figure 2). The next phase of work will focus on using geologic and geophysical exploration to target potential extensions of this higher grade zone. The mineralization also remains open down-dip. In addition to this Unkur Copper-Silver Project Inferred Mineral Resource area and its potential extensions, there are numerous additional occurrences of copper-silver mineralization and geochemical / geophysical anomalies within the Company’s 5,390 hectare Unkur License.
DETAILS OF MINERAL RESOURCE ESTIMATE DATED 31 MARCH 2017
Details of Mineral Resource estimate dated 31 March 2017
The Mineral Resource estimate was prepared by SRK, under the direction of Robin Simpson MAIG, an independent Qualified Person as defined by National Instrument 43-101 ("NI 43-101"). The results are reported in accordance with NI 43-101 and the 2014 CIM Definition Standards. The Qualified Person visited the Unkur Copper-Silver Project and SGS Laboratories in Chita during October 2016.
Robin Simpson has approved this written disclosure of the Mineral Resource estimate.
Data verification
The Qualified Person has verified the database the Mineral Resource estimate is based on. This verification was done by personal inspection of drill core, drill sites and trenches during the site visit, and by checking database content against primary data sources and historical information.
Exploration Information
The estimate is based on 4,580 meters of diamond drilling (from 16 drill-holes) and 186 meters of channel sampling (from four trenches), completed during Azarga Metals’ exploration campaign from August 2016 until February 2017.
In the opinion of the Qualified Person, the core and channel samples collected by Azarga Metals are sufficiently accurate and reliable for use in Mineral Resource estimation, and there are no material data quality issues related to drilling, sampling, recovery or other factors.
Intervals identified by Azarga Metals’ geologists as potentially mineralized were sampled, typically on one meter lengths. The half-core samples from drill core, and channel samples from trenches, were sent to SGS Laboratories in Chita for analysis of copper and silver. Standard QA/QC protocols were followed, including analysis of duplicates and standards and check analyses by ALS Laboratories in Chita. The results of this QA/QC checking will be presented in the forthcoming Technical Report.
The main identified zone of copper-silver mineralization (Zone 1) is intersected by 13 drill-holes and two trenches. Drill-hole collar and trench locations are tabulated in Table 2 and the mineralized intersections are summarized in Table 3. The locations of these intersections are shown in Figure 3.
Table 2: Drill-hole collar and trench locations from August 2016 to February 2017 physical exploration program at Unkur Copper-Silver Project
| Hole or trench ID | X | Y |
Z (RL m) |
Maximum depth (m) |
Starting dip (deg) |
Starting azimuth (deg) |
| AM-020 | 20595906 | 6303578 | 902.7 | 284.9 | -70 | 249 |
| AM-001 | 20595871 | 6303108 | 929.7 | 400.5 | -69 | 241 |
| AM-002 | 20596077 | 6303227 | 919.4 | 520.5 | -70 | 248 |
| AM-003 | 20595911 | 6302753 | 930.5 | 100.0 | -72 | 242 |
| AM-004 | 20596093 | 6302871 | 935.5 | 382.9 | -70 | 242 |
| AM-005 | 20596247 | 6302510 | 913.7 | 160.0 | -71 | 241 |
| AM-006 | 20596388 | 6302620 | 955.1 | 572.0 | -69 | 221 |
| AM-007 | 20596411 | 6302155 | 927.7 | 80.0 | -70 | 222 |
| AM-008 | 20596611 | 6302365 | 1,007.8 | 601.3 | -72 | 228 |
| AM-009 | 20596725 | 6301968 | 983.0 | 238.0 | -69 | 224 |
| AM-011 | 20596936 | 6301672 | 952.3 | 178.5 | -68 | 223 |
| AM-013 | 20597233 | 6301394 | 995.8 | 100.0 | -68 | 220 |
| AM-015 | 20597567 | 6301246 | 1042.0 | 201.0 | -68 | 217 |
| AM-017 | 20596211 | 6302467 | 916.1 | 277.5 | -71 | 230 |
| AM-019 | 20596639 | 6301879 | 938.9 | 226.7 | -69 | 224 |
| AM-018 | 20595635 | 6302977 | 937.8 | 256.6 | -73 | 241 |
| TR K601 | 20596492 | 6301887 | 969.1 | 14.0 | 0 | 236 |
| TR K615 | 20597213 | 6301311 | 1,015.4 | 115.0 | 0 | 222 |
| TR K616 | 20597472 | 6301143 | 1,049.5 | 29.0 | 0 | 233 |
Table 3: Intersections used for estimation(1)
| Hole or trench ID |
From (m) |
To (m) |
Length (m) |
Copper grade (%) |
Silver grade (%) |
Copper equivalent grade (%) |
True thickness (m) |
|
| Zone 1 | ||||||||
| AM-020 | 227.0 | 241.0 | 14 | 0.51 | 28.44 | 0.79 | 10.6 | |
| AM-001(2) | 82.5 | 125.5 | 33 | 0.83 | 79.81 | 1.61 | 20.1 | |
| AM-002 | 432.5 | 472.5 | 40 | 0.31 | 12.77 | 0.44 | 33.8 | |
| AM-003(3) | 40.5 | 77.5 | 37 | 0.43 | 39.63 | 0.82 | 26.9 | |
| AM-004(4) | 319.5 | 358.5 | 31 | 0.44 | 27.23 | 0.70 | 23.7 | |
| AM-006 | 440.5 | 456.5 | 16 | 0.34 | 11.02 | 0.45 | 14.4 | |
| AM-007 | 47.0 | 60.0 | 13 | 0.25 | 17.12 | 0.41 | 10.9 | |
| AM-008 | 352.3 | 364.3 | 12 | 0.24 | 6.02 | 0.30 | 9.9 | |
| AM-011 | 145.5 | 153.9 | 8.4 | 0.92 | 61.73 | 1.52 | 7.3 | |
| AM-013 | 70.0 | 78.0 | 8 | 0.53 | 22.62 | 0.75 | 6.8 | |
| AM-015 | 135.0 | 145.0 | 10 | 0.29 | 4.55 | 0.34 | 8.7 | |
| AM-017 | 189.5 | 202.5 | 13 | 1.28 | 103.91 | 2.29 | 9.8 | |
| AM-019 | 39.0 | 49.0 | 10 | 0.48 | 12.39 | 0.60 | 8.6 | |
| TR K615 | 8.0 | 17.0 | 9 | 0.30 | 14.03 | 0.44 | 6.9 | |
| TR K616 | 18.0 | 29.0 | 11 | 0.41 | 6.32 | 0.47 | 8.1 | |
| Zone 2 (N) | ||||||||
| AM-001 | 311.5 | 346.5 | 35 | 0.47 | 43.49 | 0.89 | ||
| AM-019 | 106.0 | 119.0 | 13 | 0.17 | 4.99 | 0.22 | ||
| Zone 2 (S) | ||||||||
| TR K601 | 0.0 | 10.0 | 10 | 0.73 | 2.07 | 0.75 | ||
Notes: (1) copper and silver equivalent grades were estimated using US$3.00/lb copper price, US$20.00/oz silver price and 100% recovery using the formulae Cu eq = Cu + (0.009722 x Ag) and Ag eq = Ag + (102.86 x Cu); (2) mineralization begins at base of moraine, possibly intersection has been truncated by glacial erosion – composite excludes barren zone from 104.5 to 114.5; (3) mineralization begins at base of moraine, possibly intersection has been truncated by glacial erosion; and (4) composite excludes barren zone from 335.5 to 343.5.
Figure 3: Summary of intersections
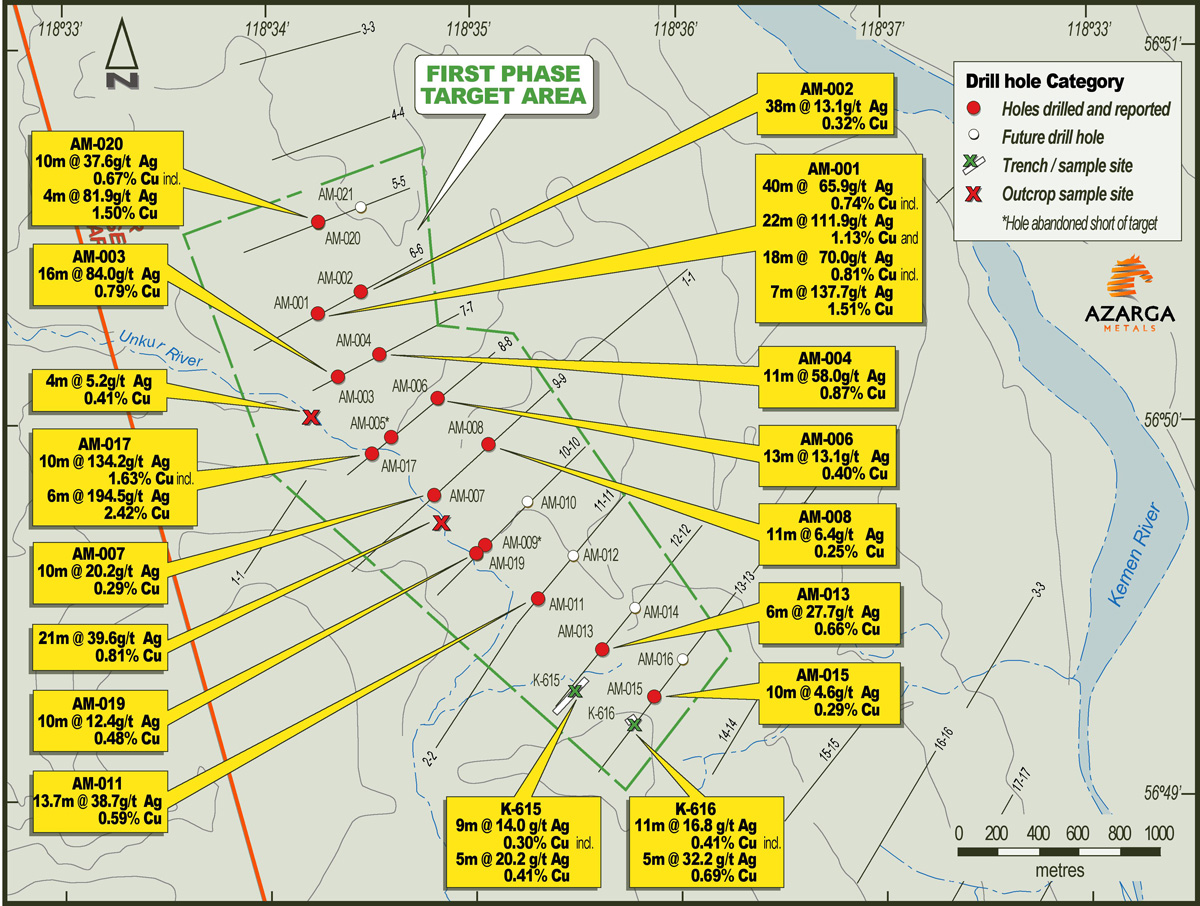
Section lines for drilling are spaced approximately 300m apart. Where there are two Zone 1 intersections on the same drill section, the spacing between intersections is typically 200m to 300m.
Estimation methodology and parameters
A wireframe interpretation of Zone 1 was constructed at a nominal threshold of 0.10% copper. Based on the limits of the current sampling coverage, the modelled domain has a strike length of 3,400 meters northwest-southeast, and a down dip extent of up to 550 meters, but this zone is open down dip and along strike in both directions. The Zone 1 domain generally dips 50 to 60 degree to the east or northeast, and has an average true thickness of 19 meters.
Approximately parallel to Zone 1, and 100 to 150m southwest, a second zone of mineralization has been interpreted, from two drill intersections, one trench intersection, and one outcrop. This second zone is stratigraphically below Zone 1.
The Lower Proterozoic sedimentary rocks that host mineralization are partly covered by Quaternary moraine. The thickness of the moraine cover over the northern part of the mineralization is up to 100 meters. The moraine cover generally is thinner to the south, and mineralization in the southern part of Zone 1 and Zone 2 can be exposed by trenching.
Topography was modelled based on drill collar locations, and using additional elevation information digitized from topographic maps.
Copper and silver grades within the Zone 1 mineralized domain were estimated by 2D Ordinary Kriging. A single 2D composite was generated for each intersection. The true thickness assigned to each composite was calculated based on the local orientations of the drill intersection and the Zone 1 wireframe. No grade capping was applied to either the samples or the composites. The block size for 2D Kriging was 100 meters north-south and 100 meters vertically. The results of the estimation were copied into a 3D block model, with sub-blocking down to 1.5625 meters, in order to achieve a good fit to the relatively narrow mineralization wireframe.
The copper and silver grades for Zone 2, which contains fewer intersections than Zone 1, were estimated by a simple average of sample grades for the northern and southern portions.
For the mineralized domains and the host rocks, a dry bulk density value of 2.67t/m3 was used for converting volumes into tonnages. This factor is the average value of samples collected by Azarga. A dry bulk density factor of 2.0t/m3 was assumed for the moraine material.
The portion of the mineralization model that met the CIM definition of a Mineral Resource ("…reasonable prospects for eventual economic extraction") was established by using NPV Scheduler software to generate a pit shell to constrain reporting of the near surface resource. The input parameters for the pit shell are shown in Table 4. Within the pit (the near surface component of the resource), no mineralized blocks have an estimated grade of less than 0.4% (copper equivalent), and no further cut-off grade was applied. Below the pit, a cut-off grade of 0.7% (copper equivalent) was applied to define an underground component of the Mineral Resource. This cut-off was estimated using the same parameters in Table 4, but assuming 20% dilution and an underground mining production cost of US$20 per tonne.
Table 4: Economic parameters for pit shell
| Parameters | Units | Amount |
| Geotechnical | ||
| - Moraine slope | Deg | 30 |
| - Bedrock slope | Deg | 45 |
| Mining factors | ||
| - Dilution (at 0 grade) | % | 5 |
| - Recovery | % | 95 |
| Processing | ||
| - Copper recovery | % | 90 |
| - Silver recovery | % | 90 |
| Operating costs | ||
| - Waste mining cost | US$/trock | 1.20 |
| - Resource mining cost | US$/trock | 1.50 |
| - Incremental mining cost | US$/1m | 0.005 |
| - Reference level | Z Elevation | 1,000 |
| - Processing cost | US$/tore | 10.00 |
| - G&A | US$/tore | 2.00 |
| - Royalty, selling cost (Cu) | % | 8.0 |
| - Royalty, selling cost (Ag) | % | 6.5 |
| Metal price | ||
| - Copper | US$/lb | 3.00 |
| - Silver | US$/oz | 20.00 |
All Mineral Resources were classified as Inferred, based on the intersection spacing relative to the interpreted continuity and potential complexity of the deposit.
Qualified Person
The Company’s President and Chief Executive Officer, Dorian L. (Dusty) Nicol, B.Sc. Geo, MA Geo, a Qualified Person as defined by NI 43-101, has reviewed and approved the exploration information disclosures contained in this Press Release.
About Azarga Metals Corp.
Azarga Metals is a mineral exploration and development company that owns 60% of the Unkur Copper-Silver Project in the Zabaikalsky province in eastern Russia.
AZARGA METALS CORP.
"Dusty Nicol"
Dorian L. (Dusty) Nicol, President and CEO
For further information please contact: Doris Meyer, at +1 604 536-2711 ext 6, or visit www.azargametals.com.
Neither the TSX Venture Exchange nor its Regulation Services Provider (as that term is defined in the policies of the TSX Venture Exchange) accepts responsibility for the adequacy or accuracy of this release.
Cautionary Statement:
This news release contains forward-looking statements that are based on the Corporation's current expectations and estimates. Forward-looking statements are frequently characterized by words such as "plan", "expect", "project", "intend", "believe", "anticipate", "estimate", "suggest", "indicate" and other similar words or statements that certain events or conditions "may" or "will" occur. Such forward-looking statements involve known and unknown risks, uncertainties and other factors that could cause actual events or results to differ materially from estimated or anticipated events or results implied or expressed in such forward-looking statements. Such factors include, among others: the actual results of current planned exploration activities; conclusions of economic evaluations; changes in project parameters as plans to continue to be refined; possible variations in ore grade or recovery rates; accidents, labour disputes and other risks of the mining industry; delays in obtaining governmental approvals or financing; and fluctuations in metal prices. There may be other factors that cause actions, events or results not to be as anticipated, estimated or intended. Any forward-looking statement speaks only as of the date on which it is made and, except as may be required by applicable securities laws, the Corporation disclaims any intent or obligation to update any forward-looking statement, whether as a result of new information, future events or results or otherwise. Forward-looking statements are not guarantees of future performance and accordingly undue reliance should not be put on such statements due to the inherent uncertainty therein.